At the end of last week, Cempra, Inc. (NASDAQ:CEMP) announced the topline results from its latest trial of solithromycin for the treatment of patients with community acquired bacterial pneumonia. The company tanked on the release, currently trading at a close to 30% discount on prerelease levels. The decline came despite the trial meeting its primary endpoints, seemingly as a result of market focus on a particular element of the adverse events data associated with trial. However, a closer look at the numbers (and the fundamentals behind the numbers) suggests an oversell based on what, in this authors opinion, is relatively meaningless data. In turn, I believe now is a good time to gain exposure to what looks like a very promising treatment ahead of NDA submissions in both Europe and the US. So, with this said, let’s look at what the numbers actually show, and try to justify the argument that Cempra is cheap at current rates.
First, a look at the drug itself. Solithromycin is part of a class of drugs called macrolides – a type of treatment used to treat infections caused by gram positive bacteria. The mechanism of action is pretty complicated, but to simplify, they essentially stop bacteria from synthesizing proteins, which translates to a breakdown of the bacteria.
In the trial, Cempra compared solithromycin to moxifloxacin – a drug currently marketed by Bayer AG (OTCMKTS:BAYRY) and used across a range of indications, including the pneumonia indication being trialed. Cempra was targeting a primary endpoint of non-inferiority, which it met. This is the first important point. Moxifloxacin is a 15-year-old, established treatment in this space, known for its strong and consistent efficacy. In a recent telephone interview, Cempra management discusses the fact that the company could have chosen a weaker comparable and achieved superiority, but that a demonstrable non inferiority to moxifloxacin strengthens the drug’s NDA on FDA submission. The trial demonstrated the non inferiority required, which means the bet paid off.
So why the decline? Well, alongside the results announcement, Cempra reported that treatment related adverse events came in at 34.3% for solithromycin versus 13.1% for moxiflaxacin. Initially, this disparity looks alarming. However, the company also reported that the vast majority of these events were infusion site pain. Moxifloxacin is a type of drug called a fluoroquinolone – not a macrolide like solithromycin. Infusion site pain is far more commonly associated with macrolides than fluoroquinolone – I’m no scientist but will hazard a guess that this has something to do with the acidity of the solution being administered. In summary, that there was a higher rate of infusion site pain in the solithromycin arm is no real surprise – and is likely not enough to put the FDA or EMA off approving the treatment, at least not on its own. Further, the company can potentially reduce the infusion site pain by reducing infusion time. Reportedly, solithromycin is as effective wit ha 30-minute infusion time – not the 50 minutes used in the trial. The company only chose 50 minutes as this is the infusion time of moxiflaxacin. A 40% reduction in infusion time would (by way of reasonable conclusion) reduce the pain associated with infusion.
Another element of the press release that sellers focused was the reported supply issues. Most media outlets stopped at that term, without delving any deeper into how these arose. In a conference call that accompanied the announcement, management outlined the process through which physicians access the drug. Essentially, they have to through an online application with a “first rate global pharma supplier”. The supplier would then ship the assigned kit to the relevant location, across a spread of 140 sites. Out of 860 doses, there were two shipping holdups in Korea, two in Russia and one in Georgia. The issues did not relate to the treatment itself and likely have no bearing on Cempra’s ability to scale and ship if it reaches commercialization. Additionally, and playing into this element of the data, because physicians chose in each case to continue with SOC treatment for the patients discontinued through supply issues, they count as failures for solithromycin. That all five turned out to be solithromycin (the trial was blind, so we would expect at least one or two issues to have been moxifloxacin), and all count as a result not only to solithromycin’s detriment but in moxiflaxacin’s favor, is unlucky.
There are a few other elements that seem to have played into the downside move. First, the trial results look a little weak when compared to the company’s results from its oral version of the same treatment. This was fully expected, however, as macrolides are more effective as an oral administrable. There are, of course, many instances where oral administration is not possible. Another relates to the company’s wording in the following statement:
Treatment emergent ALT elevations were generally asymptomatic, reversible, and not associated with increased bilirubin.
The company has said it used the word “generally” as it has two more reviews to perform on the data before it can say for certain that ALT elevations were 100% asymptomatic, but it believes this to be the case, and is simply playing it safe by using the term it used.
There are more aspects that we could highlight, but the company intends to release and present further data in the coming weeks, so its probably beneficial to wait on this data before we dig any deeper. For now, let’s just say that it looks as though Cempra has lost close to $250 million in market capitalization on a market misinterpretation of trial data – or if not a misinterpretation, an over zealous focus on an essentially irrelevant element. The results are – as the press release states – promising, despite what the market thinks, and therein lies our opportunity.


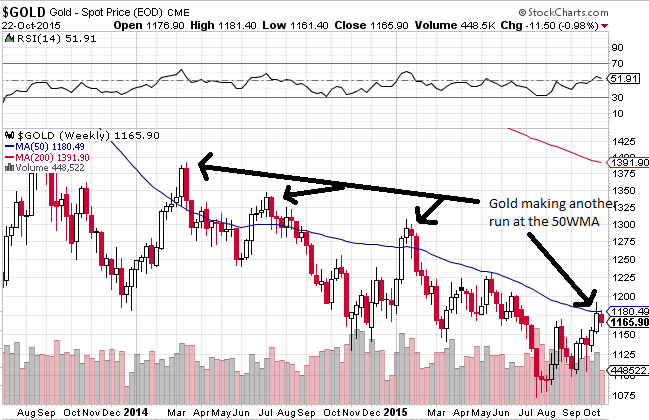 Technically things are looking good as well. If and when the new leg up begins, gold will have broken through its 50 week moving average (WMA). There have been false breakouts before that quickly fell right back through it though. If this breakout is to be real, we’ll have to see some consolidation just above that line as gold hugs the top of the 50 before attempting a run at the 200 WMA.


 Intercept Pharmaceuticals (NASDAQ:ICPT) Gilead Sciences, Inc (NASDAQ:GILD) Clovis Oncology, Inc. (NASDAQ:CLVS) Chiasma, Inc. (NASDAQ:CHMA)")
 Might Be Moving Away From Its Initial Plan With Messenger")
 Is Running Right Now")