

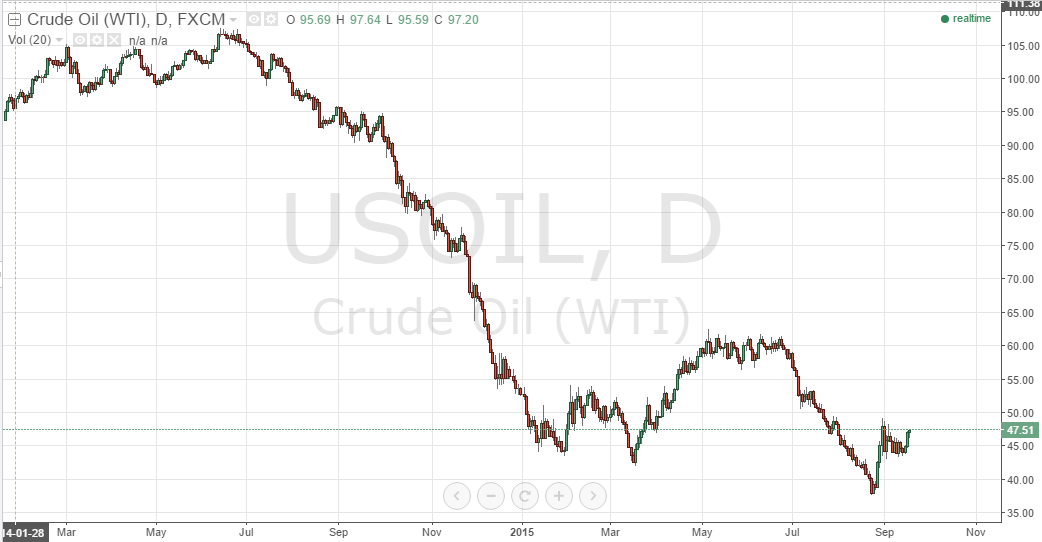
The last 12 months or so have been extremely volatile in crude oil. From 2014 highs of close to $110 a barrel, WTI declined over a seven-month period to close out the year of $45 a barrel – a 69% decline. Year-to-date, this volatility has continued. The price per barrel has fluctuated from highs a little over $62 to lows of $37, and now trades a few dollars above where we opened the year. Major energy ETFs such as United States Oil (NYSE:USO) and the Energy Select Sector SPDR ETF (NYSE:XLE) are mirroring this action. Markets are looking at these prices and questioning the driver behind all the volatility. Really, it comes down to two things – uncertainty and misinformation. A number of conflicting global economic (macro and micro) factors are playing into crude pricing at the moment, and this conflict is creating a push pull pricing effect. So, with this in mind, here’s a look at what’s playing into the price at the moment, and how we can use these factors to form a crude strategy for the next few months.
US Storage Supply
So, what’s weighing on oil?Well, the primary driver behind the steep decline seen throughout the latter half of last year and the first few months of this year was supply. A perceived US glut of crude supply led to wide news-media reporting on the issue, and investors sold out of their crude exposures accordingly. In reality, much of the supply speculation proved unfounded. A look at the EIA weekly supply stats reveals intra-annual fluctuations in supply. The comparisons used to stir up attention in the media were between highs and lows of these fluctuations – thus essentially invalid. However, sometimes (often) sentiment drives markets rather than reality.
Iran Sanctions
Another factor that has weighed on oil is what is happening in Iran. Again, however, the idea that the removal of trade barriers between Iran and the Western world will translate to oversupply is largely conjecture. Admittedly, Iran has reserves that would put it as the fourth largest oil producer in the world – somewhere around 160 million barrels proven resources. On a daily basis, however, it would only be able to produce 3.1 million barrels – a tiny portion of the more than 93 million barrels that make up daily global demand. Further, a large portion of its reserves are held offshore in tankers – somewhere around 35 million barrels. The quality of crude held in these tankers has been subject to debate recently, as has the quality of the Iranian oil infrastructure (i.e. its wells and processing facilities). At best, analysts expect around to be able to export around 180,000 barrels daily.
China and the US
Finally, we got what’s happening in China and the potential for a US rate hike putting downside pressure on the price of oil. The Chinese economy is slowing, and currently sits around 8 million barrels per day – down from 10 million barrels earlier on in the year. Combine this with a Federal Reserve rate hike (which would likely reduce US oil demand based on a reduction in capital spending from US industry) and you’ve got your justification for a slump.
Corrections
However, and as the chart shows, we are seeing upticks, and even bullish corrections, over the last couple of months? Why is this? Well, the first two reasons (US storage and Iranian export driven supply glut) are unfounded, and while wider market perception has driven the price down, market efficiency looks to have led to a correction of at least a portion of this downside momentum. Looking forward, don’t be surprised if, as markets further realize the realistic implications of these two factors, the price of oil corrects further to the upside.
Profit Taking
There is also likely an element of profit-taking from speculators on the short side of oil that initiated positions during 2014 highs. The uncertainty surrounding the forward economic strength of both China and the US (not to mention Europe) is enough to force short covering in any market. Especially one that – over the last 12 months – has proven so elastic to external influence.
Looking Forward…
So what can we expect going forward? Well, news-media will report a $50 price roof for a number of reasons. Those already mentioned as well as the ability of OPEC to manipulate supply with the goal of reducing the attractiveness of US shale prices, could – short term at least – force this roof into reality. However, looking forward, it cannot hold. At the peak of the last recession, oil priced about five or six dollars lower than the lows seen during August this year, and from those lows, corrected nearly 300% across a 2 ½ year period. Medium to long-term, look for a reversal around current levels to break the so-called price roof and return some upside momentum to oil going forward.

 Intercept Pharmaceuticals (NASDAQ:ICPT) Gilead Sciences, Inc (NASDAQ:GILD) Clovis Oncology, Inc. (NASDAQ:CLVS) Chiasma, Inc. (NASDAQ:CHMA)")
 Might Be Moving Away From Its Initial Plan With Messenger")
 Is Running Right Now")