

The yield spread is now at its lowest level since September 2007, and that signals the danger of recession. But how far away could it be? Let’s examine. The most common representation of the yield spread is, generally speaking, the 10-year minus 2-year Treasury yields. Every single recession since January 1980 has been preceded by a negative yield spread. No recession has occurred without it being preceded by a negative spread.
This is not just a coincidence, but a function of how banks create money though lending. The primary engine of money creation is banks borrowing short at lower rates and lending long at higher rates, profiting off the difference. Because of the fractional reserve system, each loan adds to the money supply, which keeps the business cycle in the boom phase. But if short term rates are higher than long term rates, banks are more likely to lose money by borrowing short and lending long, so loan growth slows down, which in turn slows down money supply growth.
We can see this a bit more clearly by juxtaposing the 10Y-2Y yield spread with loan growth over the same time period.
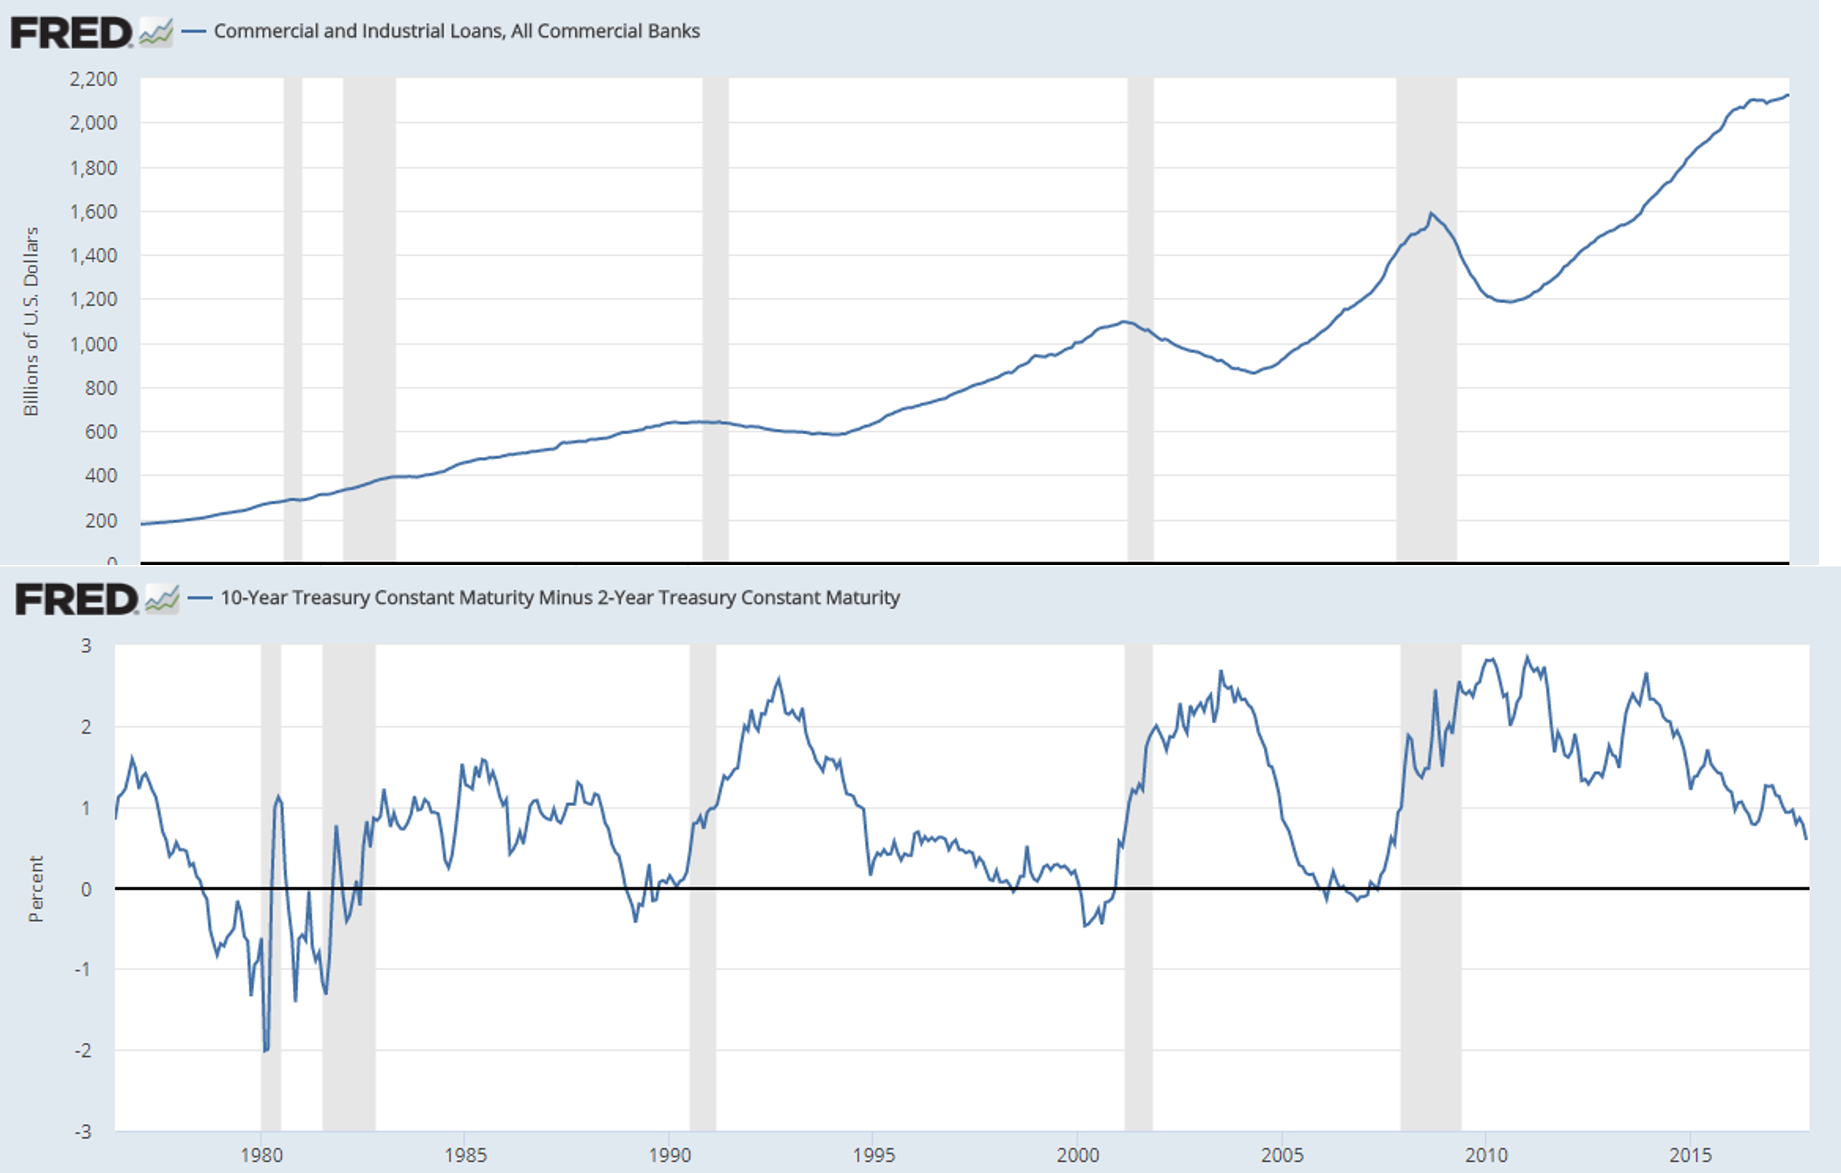
Loan growth plateaus at around the same time that recessions (shaded areas) begin. We can see that presently, top right corner, the slope of bank loan growth is already starting to flatten as the yield spread falls again. The lower the yield spread goes, the more likely loan growth will slow further, the more likely a recession becomes due to a stagnating money supply.
Let’s try to triangulate the next recession using two yield spreads. First, the traditional 10Y-2Y above, and second, the 30Y-2Y. Then we’ll average out the lag times to come up with a basic time frame as to when the next recession might begin based on two factors. First, the average lag time between negative yield spread and recession. Second, average time it takes for each yield spread to go negative from the point we are at today on both spreads.
10Y – 2Y
Right now the 10Y–2Y spread rests at 0.59. The first recession on the graph above began in January 1980. There was a lag time of 17 months from the beginning of a negative yield spread in August 1978 until the recession. From 0.59 until entering negative territory took 11 months, for a total of 27 months.
Then, there was a 10-month lag time from the next dip into negative until the recession of July 1981. From 0.59 to negative took about 2 months, for a total of 12 months.
The next recession began in July 1990. The yield spread dipped into negative territory in December 1988, for a lag time of 7 months. It took 4 months to get to negative from 0.59, for a total of 11 months.
11 years later, a recession began in March 2001. The yield spread went negative 15 months beforehand in January 2000. The situation here was rather remarkable because it took a whopping 62 months to get from 0.59 to negative, for a total of 77 months from the point where we are now to recession, over six years.
The most recent recession officially began in December 2007 and the numbers here are more in line with the previous three recessions. The yield spread went negative in June 2006 18 months beforehand. It took 9 months to get from 0.59 to negative, for a total of 27 months.
Averaging out all the numbers and we have about 30 months until the next recession from where we are now on the 10Y-2Y yield spread. If we take out the outliers on both sides, the average is 22 months.
30Y – 2Y
The numbers for the 30Y-2Y yield spread are slightly different. We are now at a positive spread of 1.03.
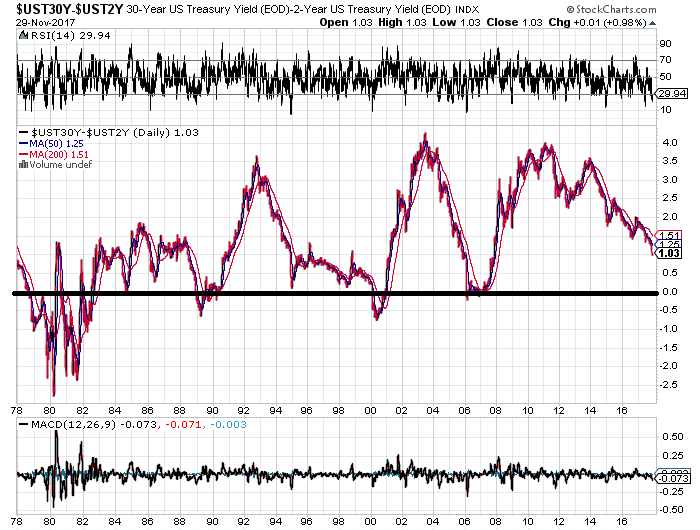
The recession of January 1980 was preceded by a negative spread that began in September 1978 for a 16-month lag. It took 13 months to get from 1.03 to negative, for a total of 29 months. The recession of July 1981 was preceded by a negative spread that began in August 1980, but the move down from 1.03 took less than a month. Total lag time then was only about 12 months.
Moving on, the recession of July 1990 was preceded by a negative spread in January 1989, and it took 7 months to move from 1.03 to negative, total lag time 25 months. Once again the outlier of the 2001 recession saw a lag from 1.03 to negative spread to recession of a whopping 74 months.
Finally, the Great Recession that began in December 2007 followed a negative spread from March 2006 plus 3 months to get from 1.03 to negative, totaling 24 months.
Total average lag time from a spread of 1.03 until recession on the 30Y-2Y then is 33 months. Take out the outliers on both ends and the average goes down to 26 months. Averaging out between both spreads comes to 31.5 months with outliers, and 24 months without.
Narrowing it Down Further
By averages, the next recession should occur in the next 2 to 3 years, but taking into account all data points, it could happen any time between 12 to 77 months from now. Granted, that doesn’t say much, but we can try to narrow it down further. We know that from the point of a negative spread until recession is about 15 months on average taking into account both spreads, and the standard deviation in that amount of time is negligible. The question then becomes, how long will it take to get to a negative spread from here? Historically since 1978, that has been the biggest unknown. Will it be a 2000 situation where it took years, or more like a 1981 situation where it literally took only a few days?
It depends largely on the amount of pressure on the short end of the curve versus the long end. On that front we have three separate factors that could push short rates higher faster than long rates. First we have the Federal Reserve on an interest rate hike path, which affects the shortest overnight rate directly, and the short end more intensely than the long. Second, we have an announcement by the Treasury earlier this month that they will be selling more short-term paper starting next year, which puts more pressure on the short end. Third, we have the Fed paring its balance sheet. To understand the effect of this third factor, we need to see the composition of the Fed balance sheet by maturities, below.
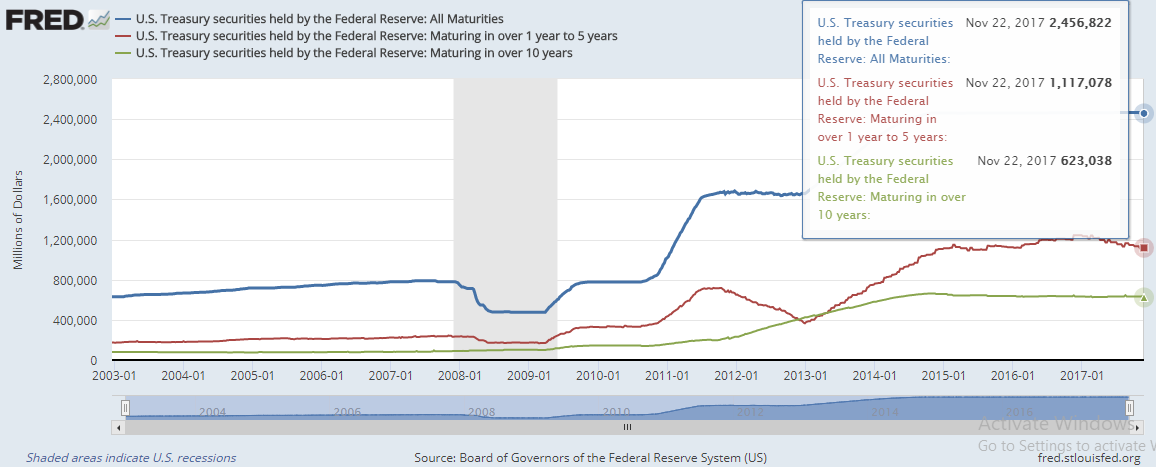
Right now, the Fed owns $1.12 trillion in 1 to 5-year paper versus only $623 billion in long term paper at 10+ years. That’s a ratio of nearly 2:1 in favor of short term. Meaning, unless the Fed intends to skew its balance sheet-paring program 2:1 in favor of long term paper, and they have made no indication of this, then the Fed’s balance sheet paring will also push short term rates higher, faster than long term.
These three factors then point to the yield spread falling relatively quickly form here. It will almost certainly not be a 70+ month wait as it was preceding the 2001 recession. Though it probably won’t be days as it was in 1981 either, the factors here indicate that it will probably turn negative some time in 2018.
Bottom line, we probably have no more than 18 months to prepare.

 Intercept Pharmaceuticals (NASDAQ:ICPT) Gilead Sciences, Inc (NASDAQ:GILD) Clovis Oncology, Inc. (NASDAQ:CLVS) Chiasma, Inc. (NASDAQ:CHMA)")
 Might Be Moving Away From Its Initial Plan With Messenger")
 Is Running Right Now")