
Wall Street participants currently have different opinions as to if the US economy is growing or not. In all fairness, both the bulls and the bears have genuine arguments regarding the direction the US economy is headed.
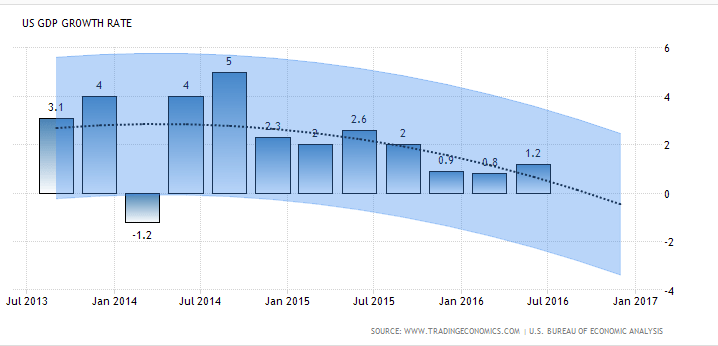
For instance, looking at the GDP data for the last five years, as displayed in the chart above, the narrative is that the US economic growth rate is shrinking. The bearish signal here receives further credence from the recent announcement by the US Department of Labor that US labor productivity per worker hour dropped at an annual rate of 0.5% during the April-to-June period, making it the third consecutive quarter of productivity declines.
However, on the other hand, other indicators including consumer spending and job data are suggesting that the US economy is growing.
Regardless of your take, though, here’s proof that the situation of things now isn’t far off what existed pre-recession and why, for investors, it is a good time to buy and trade shares.
The Labor Market Is Improving
The US economy added 225,000 jobs during the month of July – a figure that is much more than analysts’ expectation of a 182,000-job addition. This kept the unemployment rate at 4.9% – near the lowest the US economy has seen since the recession. And on an overall basis, the US unemployment rate has been on a steady decline since the recession. In fact, if the decline continues at the rate we’ve seen over the last six years, it won’t be far before we reach pre-recession levels again.
However, according to analysts, the unemployment data published by the US Bureau of Labor Statistics, as above, doesn’t tell the whole story because it only accounts for the U-3 unemployment rate. The U-3 unemployment rate only accounts for people who are unemployed but are available to work. These people must have actively looked for work during the prior four-week period. Economists, on the other hand, like to look at the U-6 unemployment data because it accounts for other classes of workers, including discouraged workers, underemployed, those pushed to work part-time because of lack of full-time positions among others. So the U-6 employment data gives a more comprehensive view of the state of the labor market. It’s always worthwhile to check this as well to see how it compares with what the BLS publishes.
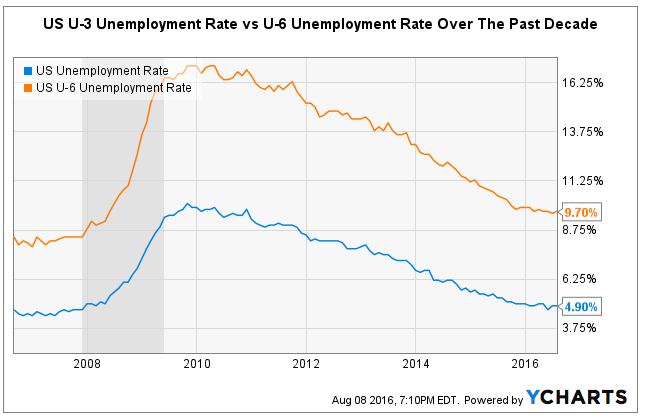
Fundamentally, since the U-6 takes into account a larger group of the labor force, it’s expected to be larger than the U-3 measure. So that’s not much of a red light.
There are two takeaways from the chart. First, the U-6 unemployment data is improving and it is gradually approaching pre-recession levels. Second, the disparity between the two measures is reducing – and gradually approaching pre-recession levels as well. At the end of 2009, still very much around the recession period, there was a 7.2 percentage-point difference between the U-3 and U-6 unemployment rates. However, that has shrunk to a 4.8 percentage-point difference this year. For reference, at the end of 2007, just before the recession, the percentage-point difference between these two was 3.8.
In essence, by consensus economists’ standard, the labor market is improving. I believe this actually supports the impressive growth in consumer spending that we have been seeing in recent years. As the overall job market improves, consumers increasingly have more to spend.
A big reason that US GDP isn’t growing impressively is found in the fact that economies around the world are weak, which is embodied in the weak net export data. Moreover, the persisting oil market turmoil has played a part in the decline of business investment in the US.
In itself, though, the US economy is growing, albeit, slowly.

 Intercept Pharmaceuticals (NASDAQ:ICPT) Gilead Sciences, Inc (NASDAQ:GILD) Clovis Oncology, Inc. (NASDAQ:CLVS) Chiasma, Inc. (NASDAQ:CHMA)")
 Might Be Moving Away From Its Initial Plan With Messenger")
 Is Running Right Now")