The extreme volatility in equities so far this month has analysts all over the bull/bear spectrum asking if the top is in, and whether stocks are in a bubble again. The answer is, it doesn’t matter. It’s only a very minor issue. Even if stocks are in a bubble and we have seen a major top, this really isn’t the issue that should be worrying investors. What needs to be monitored is not a potential bubble in the stock market, but in the bond market.
The reason is simple. We have been in an enormous bull market in bonds for over 36 years, assuming it is still going, which at this point is an open question. 36 years is older than many traders on the NYSE trading floor. If the multi-decade bond bull has already come to an end with yields bottoming in July 2016, then we have a 35-year bull market to unwind or bubble to deflate, whichever nomenclature you prefer.
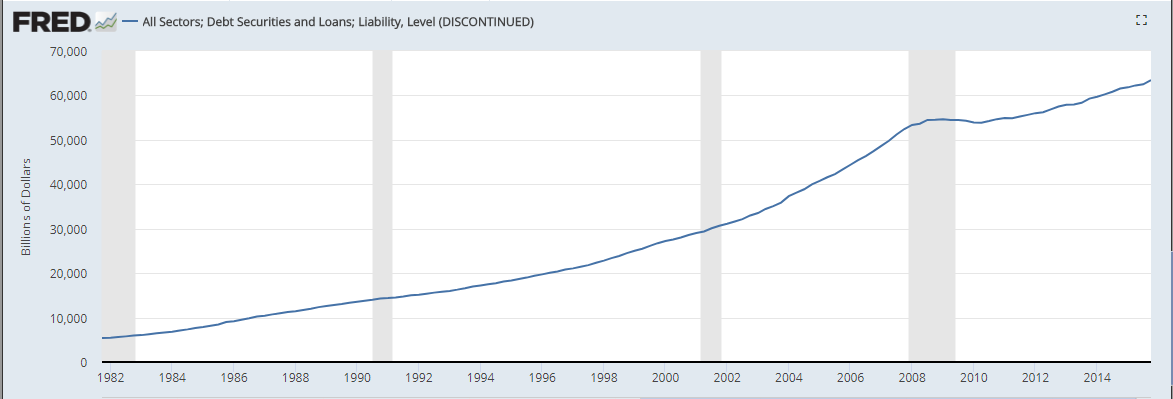
How much bigger is/was the bond bull market than equities? Let’s count from where it began in in Q4 of 1981 when yields topped and bond prices bottomed. The total value of all debt securities in the United States back then was $5.412 trillion for all sectors. Now, extrapolating from the discontinued Federal Reserve chart below, the total value of all debt securities is about $70 trillion. That’s growth of nearly 1200% in 36 years, counting all debt, public and private. 10-Year Treasury yields have gone down about 90% over this time, inversely to bond prices, an absolutely enormous and prolonged bull move.
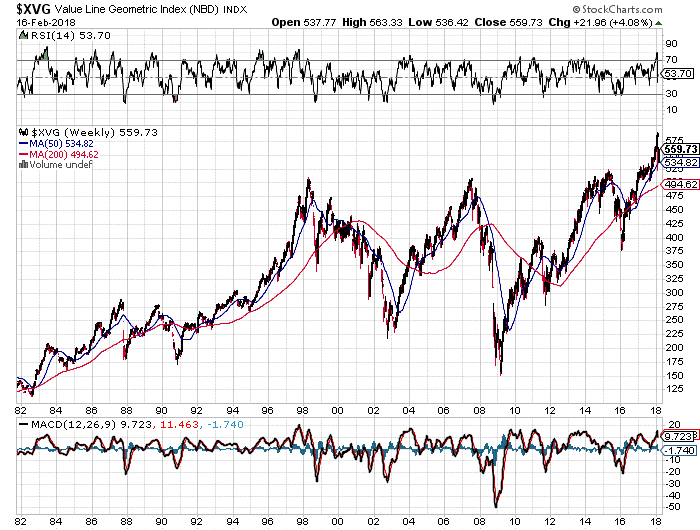
Measuring the total market cap of all equities is a bit trickier. A good measure is the Value Line Geometric Composite Index, which began accumulating data in 1961. It uses a geometric average for equal weighting of about 1675 stocks to create a broad representation of the entire US equity market. This is as opposed to looking just at the Dow 30 (NYSEARCA:DIA) or the tech-focused Nasdaq (NASDAQ:QQQ) or even the broader S&P 500 (NYSEARCA:SPY). Stocks in these indices attract disproportionate capital because of index tracking funds, and they are more well known obviously, but are not as broadly representative of the whole equity market as the VLGCI.
Since September 1981 when the bond bull market began, the total equities market, or as close as we can measure it with a single index, has looked a lot different. By the VLGCI, the average stock is up merely 370% over the past 36 years.
Compare this wild chart of stocks generally to the bond market and the big question is why have debt markets had such a consistent bull trend up but stocks have oscillated wildly for 36 years?
The answer is that whenever equities have slipped when the business cycle moves from boom to bust, the Fed steps in and stimulates the debt market with new money to lower interest rates, money that eventually finds its way back into equities and reflates stock prices. The mechanism through which stock prices are reflated is the bond market itself, which continues on its bull march through the next business cycle because the Fed always buys to reflate equities.
The real danger then is in the debt market, because that is the market that gets Fed stimulus directly, not the equity market which only gets it indirectly (unless the Fed starts buying stocks directly).
The figure that investors, both in the equity and debt markets, need to watch most closely is not a target on the S&P or any other stock index, but the 3% and then 4% yield targets on 10-year Treasuries. 3.04% is the high hit in 2013, and 4.27% is the pre-QE and pre-financial crisis high, before the Fed’s balance sheet exploded in the biggest bond-buying spree in history.
We are within 15 to 20 basis points of the 2013 high in 10-year yields. That could be taken out in a single day. From there, bonds need to be monitored very closely for signs of the unwinding of this bull market of all bull markets.
What would that mean if it unwinds? If the Fed tries to reflate the debt markets such a move at this point would just transfer losses from the debt markets into the currency markets, and down goes the dollar. The Fed cannot reflate both the bond market and strengthen the dollar. It’s one of the two. That all this debt cannot be repaid is a given, so there are only two choices. Either a debt crisis or a dollar crisis. Any stock market crisis would be a side show and pale in comparison to turmoil in either of the other two.


