Home Blog Page 14619

Gold Bottom Watch, 2008 vs Now

Gold Bull

Gold continues to drift off its bottom of $1,080.80 an ounce hit on July 24. We are now about 7.5% off those lows, and it has taken us two and a half months to get there. If this is indeed a bottom it is very unlike the 2008 bottom hit on October 22.

On October 22, 2008, the SPDR Gold Trust (NYSEARCA:GLD) traded in a range of 14% in a single day, closing more than 8% off its lows that day. That’s more than gold has moved up since the recent bottom over 2 months ago. The October 2008 bottom was a bottom that resembled a rubber ball being slammed to the floor and bouncing right back up. Gold’s action since July has resembled more of the proverbial climb of the wall of worry.

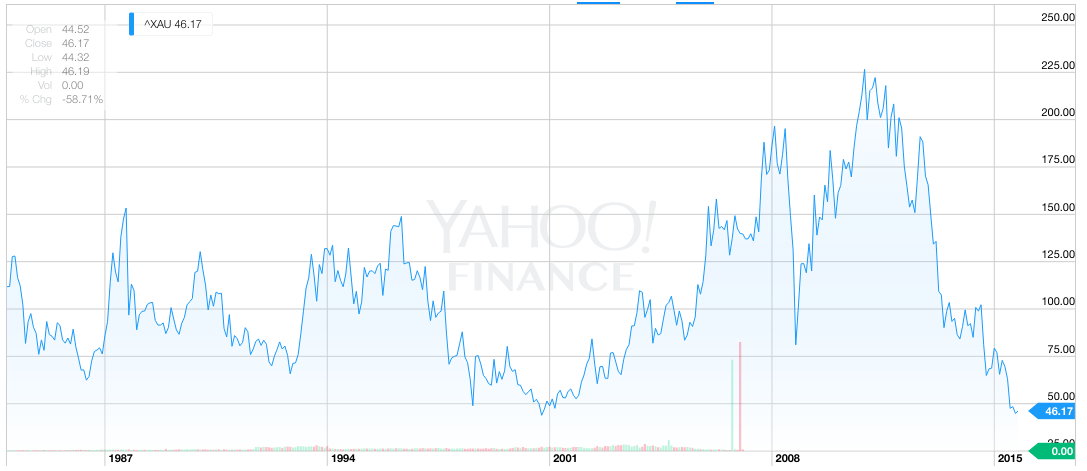
The difference between 2008 and now is that 2008 was not a bear market bottom, because there was no gold bear market in 2008. It was the end of a correction, and it ended with a very strong bounce. The last true gold bear market bottom ended with a slow climb from 1999 until 2002. Bear markets don’t usually end with strong bounces, but with slow gradual climbs like we are seeing now.

The Gold Bugs Index (^HUI) is still outperforming gold by a large margin of 28% to 7.5%, still consistent with bull market action. Today’s pullback in the major gold miners (NYSEARCA:GDX) despite gold’s continued slow push higher should not be viewed as anything more than a technical pullback following gold’s failed push through resistance at $1,170. Immediately upon hitting that number in the futures market, the metal traded down immediately as technical traders sold at resistance, with gold stocks taking the brunt of the selloff. If this keeps happening then it could signal trouble, but once is no cause for alarm.

The $1,170 area has been serving as key resistance since late 2014 and if and when gold breaks through that barrier, the chances of the final bottom already being printed rise even more. We hit that level today and bounced back down again, but it is very unusual for any asset class that has been in a protracted bear to break through resistance on the first try. The next time $1,170 is approached, gold should break through, assuming we are in a new bull market.

What we should see now is another few days of basing until gold makes another run at $1,170. When it breaks through, we should also see commenters and analysts trying to pick a top, which should signal that the wall of worry is still intact.

The less bullish people become as the gold price rises, the higher the chances are that we are actually in a new gold bull market rather than a bear market rally.


Story continues below

Monday’s Movers and Shakers in Biotech

biotech

For a number of companies, the close of last week brought with it considerable volatility in biotech. For some, the volatility added some much needed strength against a backdrop of the weakening wider biotech space. For others, there came no such reprieve, and for one in particular, Friday will be looked back on as a black day. So, with this said, let’s take a look at what went on in biotech.

Nobilis Health Corp. (NHC.TO)

First then, let’s look at Nobilis. From highs a little ahead of $7 flat on Friday morning, Nobilis crashed to close out the day at $4.93 – a 30% decline in a matter of hours. As is its prerogative, the Investment Industry Regulatory Organization of Canada (“IIROC”) halted trading mid session, stemming what could have been an even deeper decline. The organization reinstated trading at market close, which gave Nobilis the weekend to report its take on the drop. Despite having this time, however, the company kept quiet, only reporting that it was not aware of any material development that drove the decline. For those not familiar with Nobilis, the company is a healthcare marketing company that delivers pharmaceutical marketing direct to patients via hospitals it owns, manages and partners with. The question we need to ask now is whether the decline is the beginning of a larger bear trend, or whether it is an anomaly that, in turn, offers an opportunity to pick up an exposure at a discount. Well, in the last 12 months the company has grown its revenues from less than $20 million to more than $60 million as reported last quarter. The recent decline means the company is trading at a market cap of a little over 6 X revenues, which if the decline does turn out on anomaly, looks attractive. Of course, there may be something we don’t know. It might be worth waiting on any updates before taking on this amount of risk.

LDR Holding Corporation (NASDAQ:LDRH)

Next up, LDR. This company designs and develops medical devices targeted at improving the surgical biotech space, with a specific focus on the spine. The company is set to report its Q3 2015 earnings on November 4, 2015, and it announced some preliminary expectations on Friday. The expectations missed considerably on the numbers offered as guidance by analysts that follow the company, and this translated to an immediate downside hit for LDR throughout Friday’s US session. The company declined from Friday’s open at $36 flat to close out the day a little over $26 – a 28% decline across the session. Exactly what the markets will make of LDR as we head into a fresh session is unclear, but from an objective perspective the decline looks a little harsh. Yes, the company missed on expectations, but only by a few percentage points, and still expects to report quarterly revenues of a little over $40 million – a circa 10% gain on the comparable quarter last year. With this in mind, the decline may be an exaggerated response to an earnings surprise in the wake of the bearish wider biotech sentiment, and once again, might offer a nice discounted exposure for the more risk tolerant biotech investor. Just as with Nobilis, however, there is an addendum. Selloffs will often breed collateral selloff, so a little patience might be worth a lot before deciding on, or against, an exposure.

Eli Lilly and Company (NYSE:LLY)

Moving to the mega caps, let’s close this one out with Eli Lilly. As with the other two, Eli lost a considerable portion of its market capitalization, in this instance pre market today – declines that look set to continue as we head into today’s session. The company announced before market open that it was pitching to discontinue the development of evacetrapib – its lead cholesterol candidate. Eli announced its phase III trial, which has taken place across more than 500 sites and more than 12,000 patients, will be discontinued on the back of a lack of demonstrable, statistically significant efficacy. Investors had been looking to the drug as a potential exposure to a multi billion-dollar industry, and having spent triple digit millions on evacetrapib to date, have taken a big hit on its discontinuation. The company’s stock has reacted accordingly, with premarket showing a close to 8% decline on Friday’s close. Expect further declines during today’s US session, as investors that picked up an exposure in anticipation of the treatment’s phase III success cut losses and limit damages.


Story continues below

Germany’s Bundesbank Publishes its Gold Holdings, What Now?

German gold

Yesterday, Germany’s Central Bank the Bundesbank published a 2,300 page list of its gold holdings. The bars are held in Germany, England, France, and the Federal Reserve Bank of New York. A total of 109 million ounces are held between the sites, with the Fed holding the lion’s share of 46.5 million ounces.

What remains unclear is how the bars were counted or tested, given that the purity of each bar is listed to the ten thousandth of a percent, and how Germany knows that the the gold set aside as its own is actually its own and not used as the reserve for a different country. In other words, how can Germany be sure that the Federal Reserve is not engaged in fractional reserve gold banking?

One argument is that it doesn’t matter, because as long as the Fed says that Germany owns X gold, that gold can be “used” to pay off debts and transferred in title to someone else or some other country. In the words of CNBC’s John Carney:

In reality, it does not matter one bit whether the Federal Reserve Bank of New York actually has the German central bank’s gold or whether the gold is pure. As long as the Fed says it is there, it is as good as there for all practical purposes to which it might be put. It can be sold, leased out, used as collateral, employed to extinguish liabilities and counted as bank capital just the same whether it exists or not.

This argument is preposterous. Just as fractional reserve banking can lead to bank runs and financial crises, so can a gold run on a central bank. As long as nobody wants the gold physically back, then a fractional reserve gold system, supposing it exists, can continue, with the only effect being the ability to inflate the money supply more. The supply of gold is thought to be more than it is, and therefore the price of gold goes down and the relative value of a fiat dollar or Euro goes up in gold terms, giving cover to central banks to print more money. This is what reinforces faith in central banks and the entire fiat monetary system.

But if the gold is not actually there, then faith in central banks vanishes. This would be no big deal if not for the fact that central banks produce all the fiat currency in the world, the value of which is backed by faith in central banks.

The effect then would be a massive revaluation of gold and global fiat currencies, as the world begins to realize that the supply of gold held by central banks is really much smaller than all the central banks claim it is.

Carney realizes this without explicitly spelling out the consequences:

There is nothing to be gained by inspecting the gold. If it is all there and pure, there is no difference from an undiscovered absence. But if the gold isn’t there, well, calamity could follow as trust in the central bank gold depositories evaporated instantly.

So on the one hand Carney says it doesn’t matter. On the other hand, he says that calamity is at the doorstep if the gold is not there. What Carney is saying is that if it isn’t there, the monetary system as we know it could break down, leaving gold holders suddenly with a lot of purchasing power that used to be in the hands of fiat currency holders (read banks and central banks).

Story continues below

Today’s Biggest Movers Across the Large and Small of Biotech

biotech

Volatility across the biotech space has been rife today, with a number of companies registering double digit shifts throughout the morning session in the US. Here’s a list of today’s movers and shakers, up and down, across the biotech market cap spectrum.

ContraVir Pharmaceuticals, Inc. (NASDAQ:CTRV)

First up, ContraVir. The company kicked of today’s session at 3.21 – a close to 20% decline on yesterday’s close, and promptly dropped to intraday lows of 3.04. A brief recovery carved out intraday highs of 3.39, but the correction didn’t last and the company is currently trading about 19% off the open. The decline comes as ContraVir announced the pricing of a secondary warrant offering at $3.00 a share – a full 25% discount on yesterday’s market price. Understandable this discount has spooked markets (if an investor can pick up an exposure through a  warrant offering at a 25% discount to the price he or she need pay on the open market, why would they even consider the latter) and the company is suffering as a result. 3.00 flat is the level to watch here. ContraVir has tested it as support on a few occasions this year (March, April, May) and on each occasion it has held firm. If we break below, however, we could see a sustained sell of as long position stops get taken out.

Genocea Biosciences, Inc. (NASDAQ:GNCA)

Shortly before markets opened this morning, Genocea announced interim data from an ongoing trial of its lead pipeline candidate – GEN-003. The company is currently trading at a circa 65% discount on 2015 highs, having underpriced a public offering back at the end of July and reversing to trade to the downside ever since, but the latest announcement could be the catalyst required to spark an overarching bullish reversal. Mid US session, Genocea is up close to 10% on Tuesday’s close, and we could see further upside action before the day is out. Highs (intraday) of 8.00 are the ones to watch going into the US afternoon. The stock opened up the day around this level and has since declined to close up the gap left on the premarket jump, but support just ahead of 6.00 suggests short term profit taking on the gap and, in turn, that the medium term bulls are very much still in control.

Celgene Corporation (NASDAQ:CELG)

Shifting to the other end of the biotech market cap spectrum, Celgene is up 4.5% on the US session open, with the gains playing off against some off yesterday’s losses. The action yesterday came on the back of a broader biotech selloff, but today’s correction suggests there remains long interest in Celgene going forward. Volume at mid session Wednesday already sits at or around average full day volume across 2015 trading, so expect further gains as we head into the US afternoon as more participants look to get in at the discount today’s rate offers – circa 17% on 2015 highs recorded in July. As a reinforcing factor behind today’s gains, JP Morgan upgraded this one to overweight from neutral at the beginning of the month, highlighting institutional support from a fundamental perspective.

Amgen Inc. (NASDAQ:AMGN)

Sticking with the mega caps, Amgen is up 3.5% at last count, bringing its mid session market cap to a little over $110 billion on Wednesday. The gain comes as a result of q recent Express Scripts (NASDAQ:ESRX) announcement that it will extend coverage to a host of new cholesterol treatments as part of its 2016 inventory – one of which is Amgen’s PCSK9 inhibitor Repatha, which the FDA approved late August this year. As with Celgene, the gains offset a certain portion of the losses seen in yesterday’s wider market selloff, but whether we will see a continuation as we head into today’s afternoon session and beyond remains to be seen. As a side note, Regeneron Pharmaceuticals (NASDAQ:REGN) also gained on the Express Scripts announcement, as the inclusion will also cover its own PCSK9 inhibitor. The latter is up 35% at time of writing.

Story continues below

The Hallmark of a Gold Bottom

Bear Market Bottom

Precious metals had another great day at the office today as gold (NYSEARCA:GLD) pushed another full percent higher with silver (NYSEARCA:SLV) up 1.2%. The gold bugs index (^HUI) rocketed up another 5.2%, and this is perhaps the more important move indicating a possible final bear market bottom in gold and the entire metals complex.

From gold’s intermediate bottom in late October 2008 until bull market top in September 2011, the HUI went up an astonishing 274%, nearly tripling. The metal itself “only” went up 154%, meaning the stocks led the metal decidedly out of the bottom. Contrast that with the current 4 year bear market in gold, and for every brief rally, gold stocks vastly underperformed the underlying metal during every leg down.

In terms of the way up, the first week of gold’s climb out of the intermediate bottom of late October 2008 looks very much like the rally happening now. Back then, gold rallied 7.5% from its lows on October 22 until the October 31 close. The HUI had rallied 35% over the same timeframe. Now, gold has rallied 6.2% off its bottom on August 5. The HUI has rallied 25% since then. Both initial climbs out of the bottom saw mining stocks outperform gold by over a factor of 4.

More important than the way up though, is the way down. The hallmark of a major bottom in the gold market is relatively strong gold stocks especially on the way down. If, during the coming inevitable pullbacks in gold, the HUI and its associated stocks retain relative strength on a day to day basis, then that is a strong sign that we have seen the final bottom. Relative strength does not necessarily mean that gold stock ETFs (NYSEARCA:GDX) need to decline less than the underlying metal on any given down day. Since gold stocks generally outperform gold on good days, all we really need to see is the stocks more or less keeping pace with gold itself on down days.

So if we see gold go down, say, 1% tomorrow on a technical pullback and gold stocks go down only 1% with it, that would still be relative outperformance by the stocks over the metal. An interesting technical experiment over the next two months could help clarify the issue significantly. Keep track of the down days until the end of the year, to pick a round date. If on the majority of those down days, the majors and the juniors (NYSEARCA:GDXJ) tend to keep pace with gold, then it would seem the bottom was printed in gold in early August already. A few days of underperformance are still allowed.

If, however, on the down days the stocks tank hard consistently, then this may just be another bear market rally. In any case, it will be the down days that are much more telling than the up days like the one we had today.

Disclosure: At the time of writing, the author was long gold and mining stocks.

Story continues below

Market Roundup – Tuesday, October 6, 2015

bluebird

Global equities markets gained strength on Monday, as a slew of disappointing economic data translated to expectations of a further delay in the US rate hike. The S&P 500 (^GSPC) gained just shy of 2% to close out the session at 1985 flat, while the Dow Jones Industrial Average (^DJI) reached session highs of 16798 to close out a few points shy of highs at 16776. Across the pond the FTSE 100 (^FTSE) followed suit, gaining 1.7% to close out the day bang on session highs of 6336.

The action came as European purchasing managers’ index (PMI) data out of Germany, Spain, Italy, the UK and the wider Eurozone missed expectations, fuelling the suggestion that the Eurozone remains very much on the wrong side of the growth curve. This, in turn, suggests the single currency region may not be able to withstand the restriction of global liquidity a US rate hike would create.

A similar situation played out in the US, where services PMI data came in on the button but lackluster from a historical perspective, and non-manufacturing PMI missed 56.9 on expectations of 57. So with did this create some equities market strength? Well, the weaker global economies are (as inferred by disappointing data) the less likely Janet Yellen and the Federal Reserve are to raise rates in the US. A continuation of loose monetary policy translates to a continuation of readily available, very cheap investment capital, which boosts markets.

ECB President Mario Draghi is set to take the stage early afternoon (US session) – an event that will likely overshadow any of the day’s major data releases from a volatility perspective. Nobody really expects any hawkishness, so if we get even the slightest hint that he is considering raising rates, expect some weakness in European equities.

Looking at today’s Draghi speech from a currencies perspective, look for the expected dovishness to weaken the Euro versus its Dollar counterpart. The EURUSD has stagnated somewhat over the past week or so, but if we get a breakout, 1.1100 support could quickly evaporate.

The RBA maintained rates at 2% on Monday night. Most expected this maintaining, but against a backdrop of equities market weakness in Australia there was always the potential for a cut. This translated to some pent up pressure in the value of the Aussie versus its major counterparts, which in turn translated to a jolt of bullish momentum in the AUDUSD on the announcement of the hold. We’ve got new home sales data out of Australia this evening, so expect anything below the previous figure of a 0.4% decline to temporarily halt this upside momentum. 0.7200 will likely be key near term.

Gold weakened slightly on Monday, as an inverse response to the risk on sentiment that saw equities rally. On Tuesday, however, the yellow metal has recouped Monday’s losses and trades mid US session at a little over $1149 an ounce. Keep in mind that Draghi’s speech will likely dictate the near term action in the XAUUSD, with a dovish tone likely to mark a return to yesterday’s bearish momentum and weaken gold further. This is short term, of course. Longer term a dovish tone suggests Draghi is not confident about the condition of the Eurozone, and hints at a shift to global risk off sentiment moving forward.

Looking at energies, crude gained on Monday to build on the strength seen heading into the end of last week, and mid US session on Tuesday looks set to continue run. A break above 50 (WTI is currently trading just shy of $48 flat) would likely result in further strength from a technical perspective.

Story continues below

Gold Stocks Bouncing Off Historic Bottom as Miners Lead

Gold Backed Dollar

This was little reported anywhere, but the PHLX Gold/Silver Sector index (^XAU) appears to be bouncing today off of historic lows set all the way back in 2001.

PHLX Gold/Silver Sector Price action in gold stocks was quite out of the ordinary today as the major miners (NYSEARCA:GDX) rallied 2.5% despite the fact that gold fell substantially. Such action in the past has usually led to gains in the metals themselves in the days and weeks following. It is not uncommon for the stocks to lead the underlying commodity out of both short erm and long term bottoms. We will see if this is going to be the case tomorrow as well.

Speaking more broadly, the last time the PHLX Gold/Silver Sector found a major bottom was on October 1, 2008, 7 years ago to the day. In the two years following, the index gained close to 200%. The lows being approached now on the index are 50% below the low in 2008, and the price of gold is still 50% higher than it was back then. Something is way off balance here, and the correction back up, when it comes, could be extreme.

That means when the pressure is finally released in this sector, the ensuing bull market could rival anything we have seen so far in the gold market since the bubble top of 1980.

On the side of a bottom is the now-increasing growth rate of the money supply, which seems to have bottomed out last month and is now growing fast once again. Action tomorrow in the metals should be very telling as to what direction we will take over the next few weeks. Where the next intermediate low is should also tell us if this is indeed a bear market bottom or just another bear market rally in gold.

Continued strength in the mining sector here could mark as major a bottom as bottoms get in gold stocks going out decades. It just shows how low we have gone considering that the gold price has not even halved since the bull market top in 2011, while gold stocks have lost an average 80% of their value.

Disclosure: At the time of writing, the author was long GDX, GDXJ, SIL. 


Story continues below

Biotechs Are Getting Slaughtered; Here’s Why…

StockMarketCrash

From mid-year highs just shy of $400 a share, the iShares Nasdaq Biotechnology (NASDAQ:IBB) now trades at $310 a – a close to 23% decline across a three-month period. A brief correction during the first two weeks of September suggested a return to the overarching bullish momentum in the biotech space as we head into the latter half of this year, but over the last two weeks, this correction has reversed and the IBB has lost more than 15% across the period. Now, analysts are suggesting that this could be the beginning of a longer-term trend reversal, and that the bearish action in biotechs could drag on to mid-2017. Some of the biggest losers in the space are the mega-cap incumbents that generally experience some level of insulation from wider market economics, current circumstances notwithstanding. Amgen Inc. (NASDAQ:AMGN) is down 22% from 2015 highs. Celgene Corporation (NASDAQ:CELG) has lost a similar portion of its market capitalization over the last six weeks. Gilead Sciences Inc. (NASDAQ:GILD) is down 18% since the end of July, and has lost an average of 2% per session for the past week. So, what’s behind the decline? Further is it purely a secondary correction on the bullish momentum we have seen for the past five years or so, or are we really looking at two years of sustained deflation in the space? Let’s try and figure it out.

The biotech space has been one of the best performing industry sectors since the last recession. Numerous companies and the major ETF’s in the sector are up triple digit percentages, and for some time now analysts have suggested the space as being in a bubble. When the suggestion of a bubble filters through to popular news media, markets will often get edgy as investors pois themselves to hit sell and book what could be already overextended profits on their long exposures. At times like this, it doesn’t take much to spook these investors, and initiate a sell-off. Over the past couple of months, we’ve had two major events that have driven this sell-off. The first was the anticipation of an interest rate hike earlier this month. While the threat of deflation remains very real in the US, markets expected Janet Yellen to raise interest rates on the back of promising employment figures. Increased rates make markets more expensive for borrowers, and as a result, will generally translate to a cool off period in equities. We got this cool off throughout August, and naturally, it impacted the sectors that markets are viewing as overinflated – namely biotech and healthcare – the hardest. The more recent event that drove last week’s sell-off, however, was politically motivated. You will no doubt already be aware of last week’s Martin Shkreli incident, which saw him attract a huge amount of negative attention on the back of his raising of the price of Daraprim from $13.50 to $750 per pill. News media quickly picked up on the story, and the incident culminated in a Tweet sent out by Hillary Clinton stating that she would implement policy to put an end to price gouging. The Tweet itself put pressure on the biotech space, but it is the wider implications that are what will put pressure on pharma going forward. Why? Because the topic has now become a major talking point on the US campaign trail. Prior to this event, the majority of the US presidency candidates had stayed away from the biotech space from a policy perspective. As the primary candidates weigh in on the matter, we can expect further downside pressure on the sector.

So what’s next? Well, the latter half of 2015 looks like a risky time to be long biotech. With US economic fundamentals becoming increasingly uncertain, and the impact of political debate now factoring in on biotech’s future, expect to see investors taking profits off the table over the coming months.

Story continues below

Sound Money Gold Standard is Slowly Creeping Back into Use

Gold Backed Dollar

Gold’s $24 jump today is coming on the heels of a market losing direction and a broader commodities complex trying to bottom. Behind the scenes are confused hedge fund managers and Fed watchers trying to think of what could possibly spur Janet Yellen to raise interest rates.

The feeling of uncertainty everywhere is pervasive, especially with continued and increasing belligerency between Russia and the United States, now on the Syrian question. Uncertainty is when gold traditionally thrives.

Behind the scenes of all this, it is becoming more and more apparent that the public is starting to catch on to the advantages of sound banking and sound money, particularly gold-backed money, and actually using it. It began with Bitcoin, which is of course not gold-backed at all, but did show a global desire for money independent of government or central bank control.

Peter Schiff, the notorious gold bug who predicted the housing bubble in 2006 and successfully shorted it, was the first to go to market with sound banking. Schiff opened his Europac Bank a few years ago, a 100% reserve bank that does not engage in any deposit lending and is therefore inherently free of systemic risk. If the bank were to go bankrupt for whatever reason, depositors would be guaranteed their deposits back not by an insurance agency, but from the bank itself.

That trend continued with the founding a BitGold, a company that serves as a kind of Paypal for its customers but exchanges gold between them instead of currency. Each account is essentially a gold-backed bank account that fluctuates in dollar value with the fluctuation of the gold price. People can now pay people in gold through the transfer of gold titles through BitGold. This essentially is a gold standard without any artificial parity between gold and the dollar.

Finally, earlier this week, the United Precious Metals Association made it possible for any American to pay any bill, including taxes, in gold dollars. Funds are deposited with the bank and converted to gold dollars through legal tender gold and silver coins. These coins can then be used in making electronic payments through an American Express (NYSE:AXP) card. Once the money leaves the American Express card, dollar value in gold weight is subtracted from a checking account.

People can essentially pay for anything in gold.

These are the first three services of this kind to crop up recently, and the more that come into existence demonstrates that more and more people are becoming interested in using sound money.

The higher gold goes relative to the dollar, the more people will be interested in taking advantage of these services, which could produce a positive feedback loop in the gold price.

Disclosure: At the time of writing, the author was long gold and gold stocks.

Story continues below

Biotech 101: Putting Together A Biotech Portfolio Using Your Personal Risk Profile

NDA

As the last half decade has shown biotechnology investments can be a very rewarding allocation. However, there are a number of ways to gain exposure to the biotech space, all of which come with varying risk reward profiles. An investor’s personal risk tolerance will generally dictate his or her allocations, with the more risk tolerant investor likely to weight a portfolio towards the potential for gains, and more risk averse investor likely to the opposite. The great thing about the biotech space is that this weighting is relatively simple to put into practice, as the sector is broken into clearly defined subsectors, each of which commands its own risk profile. So, with this said, here is how to set up your portfolio according to your personal risk tolerance. First then, let’s look at the different types of broad exposure.

Big Pharma

Across the entire biotechnology and pharmaceutical space, there are probably six or seven mega cap incumbents that make up the group you will commonly hear referred to in popular news media as Big Pharma. Companies like Gilead Sciences Inc. (NASDAQ:GILD), Amgen Inc. (NASDAQ:AMGN) and Celgene Corporation (NASDAQ:CELG) are worth hundreds of billions of dollars, and dominate the space as a result. You can think of these as the blue-chip companies of the sector, and as such, they are very low risk allocations. However, as always, this low risk has associated with it low reward. Why? Because in biotech, FDA approvals drive market valuation. Perhaps more specifically, the implications of an FDA approval on the bottom line of the company involved drive market valuation. If a microcap company gets a blockbuster (circa $1 billion) treatment approved, it is likely to have a massive impact on that company’s revenues. For a company worth hundreds of billions of dollars already, however, not so much.

Large Cap

Outside of these mega capitalization companies, you’ve got a range of large cap stocks that generate substantial revenues, and can also offer relatively low risk exposure to the biotech space. Such companies include BioMarin Pharmaceutical Inc. (NASDAQ:BMRN) and Incyte Corporation (NASDAQ:INCY). These types of companies have a market capitalization of anywhere above $10 billion, and regularly generate revenues in the hundreds of millions of dollars range. The great thing about this sector is that the size of the companies make them relatively low risk, but they also often make attractive acquisition targets for the mega caps mentioned above. Since acquisitions generally come at a premium to market price, a successful buyout can quickly offer substantial returns on an exposure.

Mid Cap

Mid cap biotech’s generally range from the $1 billion mark to the $10 billion mark valuation. Anacor Pharmaceuticals, Inc. (NASDAQ:ANAC) is a perfect example of this type of stock. They will often run at an operational loss, and have one or two approved treatments generating in the low tens of millions of dollars revenues annually. The reason most of them run at a loss is rooted in the capital expenditure associated with their ongoing development pipelines, and in these pipelines there can be substantial upside on successful approval. Mid caps are risky, generally because they require funding (often through partnerships with bigger companies) in order to maintain operations. However, some of the risk is mitigated by the fact that – as mentioned – they have products already generating revenues at market.

Small Cap

Finally, small caps. Anything with a valuation below say $250 million is probably not worth considering, so small cap sits between around the $300 million and the $1 billion market capitalization brackey. Small caps usually won’t have an FDA approved drug on their roster, and as such, won’t be generating any revenues. You may see revenues reported on submitted financials, but these generally can be attributed to research grants and cooperative milestone payments. These types of biotech companies are, of course, the most risky. The path to FDA approval is long and costly, and the vast majority of treatments fail. However, on the flipside, this risk for some investors is outweighed by the potential for huge upside gains. Clinical trial data, partnership agreements and FDA designation updates drive the valuation of these stocks, so expect volatility along the way.

Your Biotech Portfolio

How you combine these different types of increase to form a portfolio is up to you, and as we have said, will be highly dependent on your risk tolerance. However, as a guideline, a risk averse investor could allocate 75% of their biotech portfolio to large capitalization and mega capitalization companies, 15% to mid-sized biotech’s and the final 10% to a promising group of small cap stocks. An investor with a high risk tolerance, on the other hand, may want to forego some of the safety of a 75% large cap allocation in order to expand their exposure to the upside potential of mid and, in particular, small caps.

Story continues below