

Here we go again in China. When bond king Bill Gross had said to us on June 4 that Shenzhen stocks were the “short of a lifetime,” he apparently had no idea how perfect his timing was. It was perfect enough that even he didn’t capitalize on the short he called. And it looks like we’re in for crash round two after a brief reprieve, as the Shanghai index has fallen over 6% yesterday. The large cap iShares China ETF (NYSEARCA:FXI) is down 2%, with the small cap fund China A Shares (NYSEARCA:ASHR) down over 7% today.
It appears that no matter what the People’s Bank of China (PBOC) does to stop the fall, it is only successful short term. They seemingly cannot stop the bleeding for long. The PBOC may nevertheless be the only thin branch between China’s stock market and the abyss of fundamental long term revaluation downward.
This kind of market action does not happen in a vacuum. As much as Keynes and his followers want to believe that crashes only happen because of faulty “animal spirits” where a herd mentality feedback loop inexplicably forms and has everyone suddenly headed for the exit doors for no apparent reason, these things have a cause. That cause is always the central bank.
This seemingly benign chart below is the first clue.
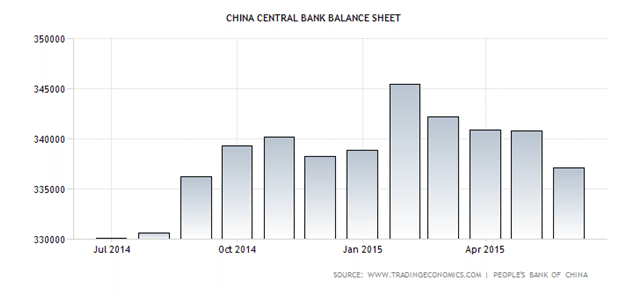 The balance sheet of China’s central bank the People’s Bank of China (PBOC) peaked in February at 34.5 trillion yuan. Since then, it has declined month after month, at least through June has the chart shows. If we take a longer view, we can see how much of an aberration a shrinking PBOC balance sheet really is.
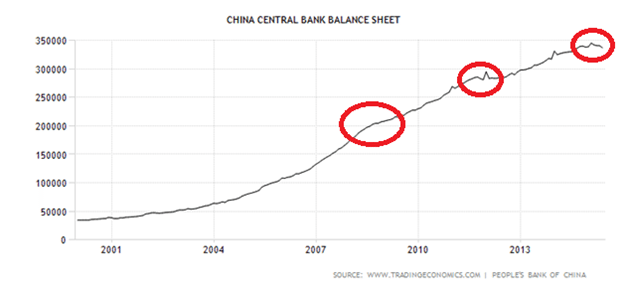 The three circles above show the three major periods since 2000 where the rate of PBOC balance sheet expansion either was severely curtailed or outright reversed. The only way a central bank can expand its balance sheet is by printing the money to do so, and when money is printed, stocks go up, because whether the PBOC is expanding its balance sheet with securities outright or buying something else, the money almost always ends up there ultimately. When that printing stops or slows suddenly, stocks go down.
The first red zone marks a lull period beginning in 2008 where the rate of balance sheet expansion suddenly slowed after a two-year burst from 2005-2007. The expansion picked up again around 2009, but suddenly stopped again in late 2011. And now, we are seeing the same stagnancy in money printing since February.
The iShares China Large Cap ETF consisting of the largest Chinese ADRs dropped 59% in 2008, 32% from May to September 2011, and has fallen 22% since its most recent peak. If we measure the most recent fall against the other two, there is still a way to go before reaching bottom.
There is hope though that this recent crash will not be as severe as what we saw in 2008 or 2011. The reason the PBOC stopped printing so abruptly those years was because of skyrocketing inflation.
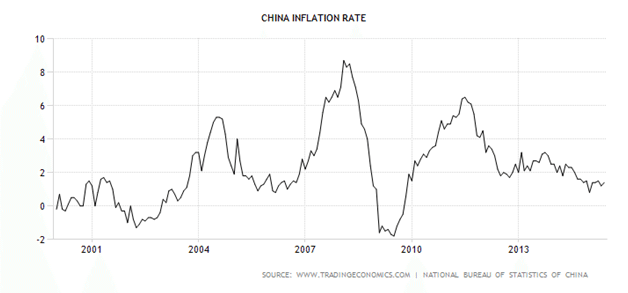 In 2008 it reached 8%, and in 2011 over 6%, and in both cases the central bank tightened monetary policy quickly in response, shrinking its balance sheet. This time, the inflation rate is muted at below 2%, if we assume the statistics are a true reflection of the Chinese economy rather than propaganda. This gives the PBOC more room to run so save the markets. How much saving will be required and for how long is the question.
Incidentally, tracking the Fed balance sheet for forecasting these kinds of moves does not work in the same way because monetary policy is literally clogged at the Fed with over $2 trillion of excess reserves backing up the works due to zero interest rates. Interest rates in China are still above 4% on the overnight rate, so there is still some control over the money supply there.

 Intercept Pharmaceuticals (NASDAQ:ICPT) Gilead Sciences, Inc (NASDAQ:GILD) Clovis Oncology, Inc. (NASDAQ:CLVS) Chiasma, Inc. (NASDAQ:CHMA)")
 Might Be Moving Away From Its Initial Plan With Messenger")
 Is Running Right Now")